Volatility Stop
get_volatility_stop(quotes, lookback_periods=7, multiplier=3)
Parameters
| name | type | notes |
|---|---|---|
quotes | Iterable[Quote] | Iterable of the Quote class or its sub-class. • See here for usage with pandas.DataFrame |
lookback_periods | int, default 7 | Number of periods (N) ATR lookback window. Must be greater than 1. |
multiplier | float, default 3 | ATR multiplier for the offset. Must be greater than 0. |
Historical quotes requirements
You must have at least N+100 periods of quotes to cover the convergence periods. Since the underlying ATR uses a smoothing technique, we recommend you use at least N+250 data points prior to the intended usage date for better precision. Initial values prior to the first reversal are not accurate and are excluded from the results. Therefore, provide sufficient quotes to capture prior trend reversals.
quotes is an Iterable[Quote] collection of historical price quotes. It should have a consistent frequency (day, hour, minute, etc). See the Guide for more information.
Return
VolatilityStopResults[VolatilityStopResult]
- This method returns a time series of all available indicator values for the
quotesprovided. VolatilityStopResultsis just a list ofVolatilityStopResult.- It always returns the same number of elements as there are in the historical quotes.
- It does not return a single incremental indicator value.
- The first trend will have
Nonevalues since it is not accurate and based on an initial guess.
⚞ Convergence warning: The first N+100 periods will have decreasing magnitude, convergence-related precision errors that can be as high as ~5% deviation in indicator values for earlier periods.
VolatilityStopResult
| name | type | notes |
|---|---|---|
date | datetime | Date |
sar | float, Optional | Stop and Reverse value contains both Upper and Lower segments |
is_stop | bool, Optional | Indicates a trend reversal |
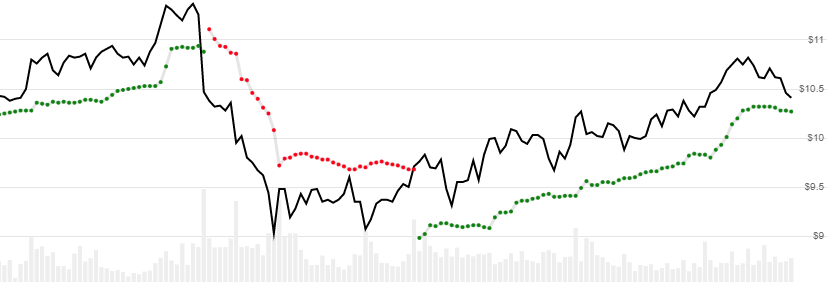
upper_band | float, Optional | Upper band only (bearish/red) |
lower_band | float, Optional | Lower band only (bullish/green) |
upper_band and lower_band values are provided to differentiate bullish vs bearish trends and to clearly demark trend reversal. sar is the contiguous combination of both upper and lower line data.
Utilities
See Utilities and Helpers for more information.
Example
from stock_indicators import indicators

# This method is NOT a part of the library.
quotes = get_historical_quotes("SPY")

# Calculate VolatilityStop(20,2.5)
results = indicators.get_volatility_stop(quotes, 20, 2.5)
About Volatility Stop
Created by J. Welles Wilder, Volatility Stop, also known his Volatility System, is an ATR based indicator used to determine trend direction, stops, and reversals. It is similar to Wilder’s Parabolic SAR and SuperTrend. [Discuss] 💬