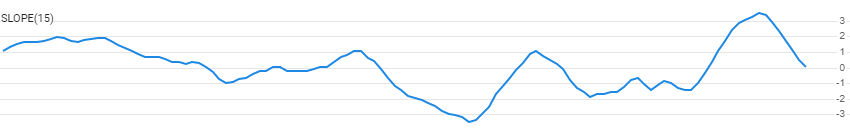
Slope and Linear Regression
get_slope(quotes, lookback_periods)
Parameters
| name | type | notes |
|---|---|---|
quotes | Iterable[Quote] | Iterable of the Quote class or its sub-class. • See here for usage with pandas.DataFrame |
lookback_periods | int | Number of periods (N) for the linear regression. Must be greater than 0. |
Historical quotes requirements
You must have at least N periods of quotes to cover the warmup periods.
quotes is an Iterable[Quote] collection of historical price quotes. It should have a consistent frequency (day, hour, minute, etc). See the Guide for more information.
Return
SlopeResults[SlopeResult]
- This method returns a time series of all available indicator values for the
quotesprovided. SlopeResultsis just a list ofSlopeResult.- It always returns the same number of elements as there are in the historical quotes.
- It does not return a single incremental indicator value.
- The first
N-1periods will haveNonevalues forslopesince there’s not enough data to calculate.
👉 Repaint warning: the
linewill be continuously repainted since it is based on the last quote and lookback period.
SlopeResult
| name | type | notes |
|---|---|---|
date | datetime | Date |
slope | float, Optional | Slope m of the best-fit line of Close price |
intercept | float, Optional | Y-Intercept b of the best-fit line |
stdev | float, Optional | Standard Deviation of Close price over N lookback periods |
r_squared | float, Optional | R-Squared (R²), aka Coefficient of Determination |
line | Decimal, Optional | Best-fit line y over the last ‘N’ periods (i.e. y=mx+b using last period values) |
Utilities
See Utilities and Helpers for more information.
Example
from stock_indicators import indicators

# This method is NOT a part of the library.
quotes = get_historical_quotes("SPY")

# calculate 20-period Slope
results = indicators.get_slope(quotes, 20)
About Slope and Linear Regression
Slope of the best fit line is determined by an ordinary least-squares simple linear regression on Close price. It can be used to help identify trend strength and direction. Standard Deviation, R², and a best-fit Line (for last lookback segment) are also output. See also Standard Deviation Channels for an alternative depiction. [Discuss] 💬